MetricKit
As an undergraduate student, I had a radio show called “Goodbye, Blue Monday” (I was really into Vonnegut at the time). It was nothing glamorous — just a weekly, 2-hour slot at the end of the night before the station switched into automation.
If you happened to be driving through the hills of Pittsburgh, Pennsylvania late at night with your radio tuned to WRCT 88.3, you’d have heard an eclectic mix of Contemporary Classical, Acid Jazz, Italian Disco, and Bebop. That, and the stilting, dulcet baritone of a college kid doing his best impersonation of Tony Mowod.
Sitting there in the booth, waiting for tracks to play out before launching into an FCC-mandated PSA or on-the-hour station identification, I’d wonder: Is anyone out there listening? And if they were, did they like it? I could’ve been broadcasting static the whole time and been none the wiser.
The same thoughts come to mind whenever I submit a build to App Store Connect… but then I’ll remember that, unlike radio, you can actually know these things! And the latest improvements in Xcode 11 make it easier than ever to get an idea of how your apps are performing in the field.
We’ll cover everything you need to know in this week’s NSHipster article. So as they say on the radio: “Don’t touch that dial (it’s got jam on it)”.
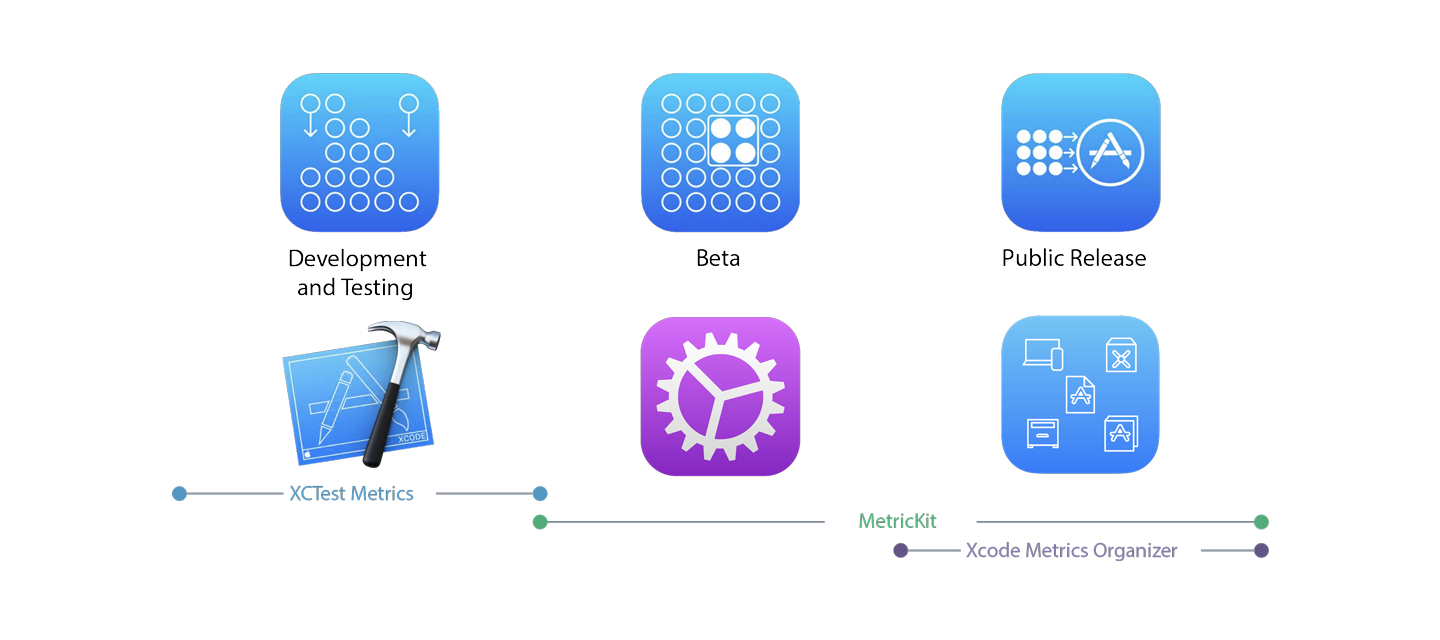
MetricKit is a new framework in iOS 13 for collecting and processing battery and performance metrics. It was announced at WWDC this year along with XCTest Metrics and the Xcode Metrics Organizer as part of a coordinated effort to bring new insights to developers about how their apps are performing in the field.

Apple automatically collects metrics from apps installed on the App Store. You can view them in Xcode 11 by opening the Organizer (⌥⌘⇧O) and selecting the new Metrics tab.
MetricKit complement Xcode Organizer Metrics by providing a programmatic way to receive daily information about how your app is performing in the field. With this information, you can collect, aggregate, and analyze on your own in greater detail than you can through Xcode.
Understanding App Metrics
Metrics can help uncover issues you might not have seen while testing locally, and allow you to track changes across different versions of your app. For this initial release, Apple has focused on the two metrics that matter most to users: battery usage and performance.
Battery Usage

Battery life depends on a lot of different factors. Physical aspects like the age of the device and the number of charge cycles are determinative, but the way your phone is used matters, too. Things like CPU usage, the brightness of the display and the colors on the screen, and how often radios are used to fetch data or get your current location — all of these can have a big impact. But the main thing to keep in mind is that users care a lot about battery life.
Aside from how good the camera is, the amount of time between charges is the deciding factor when someone buys a new phone these days. So when their new, expensive phone doesn’t make it through the day, they’re going to be pretty unhappy.
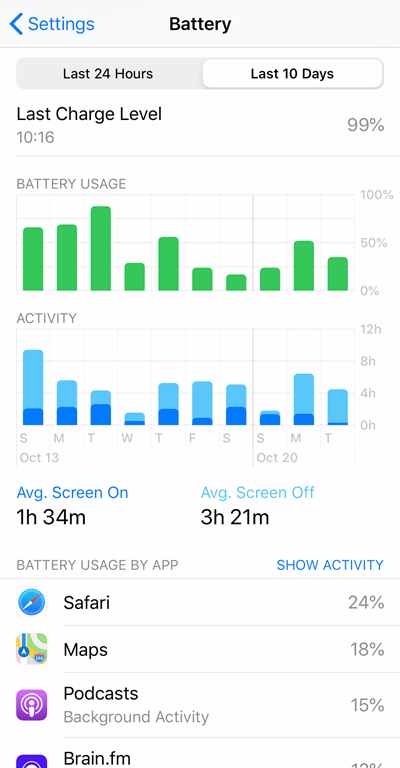
Until recently, Apple’s taken most of the heat on battery issues. But since iOS 12 and its new Battery Usage screen in Settings, users now have a way to tell when their favorite app is to blame. Fortunately, with iOS 13 you now have everything you need to make sure your app doesn’t run afoul of reasonable energy usage.
Performance
Performance is another key factor in the overall user experience. Normally, we might look to stats like processor clock speed or frame rate as a measure of performance. But instead, Apple’s focusing on less abstract and more actionable metrics:
- Hang Rate
- How often is the main / UI thread blocked, such that the app is unresponsive to user input?
- Launch Time
- How long does an app take to become usable after the user taps its icon?
- Peak Memory & Memory at Suspension
- How much memory does the app use at its peak and just before entering the background?
- Disk Writes
- How often does the app write to disk, which — if you didn’t already know — is a comparatively slow operation (even with the flash storage on an iPhone!)
Using MetricKit
From the perspective of an API consumer,
it’s hard to imagine how MetricKit could be easier to incorporate.
All you need is for some part of your app to serve as
a metric subscriber
(an obvious choice is your App),
and for it to be added to the shared MXMetric:
import UIKit
import MetriciOS automatically collects samples while your app is being used, and once per day (every 24 hours), it’ll send an aggregated report with those metrics.
To verify that your MXMetric
is having its delegate method called as expected,
select Simulate MetricKit Payloads from the Debug menu
while Xcode is running your app.
Annotating Critical Code Sections with Signposts
In addition to the baseline statistics collected for you,
you can use the
mx function
to collect metrics around the most important parts of your code.
This signpost-backed API
captures CPU time, memory, and writes to disk.
For example, if part of your app did post-processing on audio streams, you might annotate those regions with metric signposts to determine the energy and performance impact of that work:
let audioCreating a Self-Hosted Web Service for Collecting App Metrics
Now that you have this information,
what do you do with it?
How do we fill that … placeholder in our implementation of did?
You could pass that along to some paid analytics or crash reporting service, but where’s the fun in that? Let’s build our own web service to collect these for further analysis:
Storing and Querying Metrics with PostgreSQL
The MXMetric objects received by metrics manager subscribers
have a convenient
json method
that generates something like this:
Expand for JSON Representation:
{
"locationAs you can see,
there’s a lot baked into this representation.
Defining a schema for all of this information would be a lot of work,
and there’s no guarantee that this won’t change in the future.
So instead,
let’s embrace the NoSQL paradigm
(albeit responsibly, using Postgres)
by storing payloads in a JSONB column:
CREATE TABLE IF NOT EXISTS metrics (
    id BIGINT GENERATED BY DEFAULT AS IDENTITY PRIMARY KEY,
    payload JSONB NOT NULL
);
So easy!
We can extract individual fields from payloads using JSON operators like so:
SELECT (payload -> 'applicationAdvanced: Creating Views
JSON operators in PostgreSQL can be cumbersome to work with — especially for more complex queries. One way to help with that is to create a view (materialized or otherwise) to project the most important information to you in the most convenient representation:
CREATE VIEW key_performance_indicators AS
SELECT
id,
(payload -> 'appWith views, you can perform aggregate queries over all of your metrics JSON payloads with the convenience of a schema-backed relational database:
SELECT avg(cumulative_foreground_time)
FROM key_performance_indicators;
--         avg
-- ══════════════════
--  @ 9 mins 41 secs

SELECT app_version, percentile_disc(0.5)
         WITHIN GROUP (ORDER BY peak_memory_usage_bytes)
         AS median
FROM key_performance_indicators
GROUP BY app_version;
--  app_version │  median
-- ═════════════╪═══════════
--  "1.0.1"     │ 192500000
--  "1.0.0"     │ 204800000
Creating a Web Service
In this example, most of the heavy lifting is delegated to Postgres, making the server-side implementation rather boring. For completeness, here are some reference implementations in Ruby (Sinatra) and JavaScript (Express):
require 'sinatra/base'
require 'pg'
require 'sequel'

class App < Sinatra::Base
  configure do
    DB = Sequel.connect(ENV['DATABASE_URL'])
  end

  post '/collect' do
    DB[:metrics].insert(payload: request.body.read)
    status 204
  end
end
import express from 'express';
import { Pool } from 'pg';
const db = new Pool(
connectionSending Metrics as JSON
Now that we have everything set up,
the final step is to implement
the required MXMetric delegate method did
to pass that information along to our web service:
extension AppWhen you create something and put it out into the world, you lose your direct connection to it. That’s as true for apps as it is for college radio shows. Short of user research studies or invasive ad-tech, the truth is that we rarely have any clue about how people are using our software.
Metrics offer a convenient way to at least make sure that things aren’t too slow or too draining. And though they provide but a glimpse in the aggregate of how our apps are being enjoyed, it’s just enough to help us honor both our creation and our audience with a great user experience.